Reporting System
Turn field data into reports.
Explore field records from Türkiye, Georgia and Bulgaria across five modules: see pest density on the heat map, compare province and district risk levels on the risk map, see station locations on the stations page, check weather and soil data in the detail view, and analyze distributions and trends with charts.
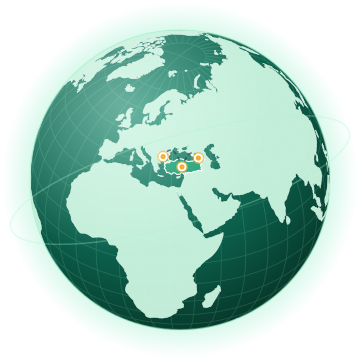
Report modules
Jump straight to the analysis you need.
Heat Map
View marker density as a heat layer and quickly spot areas where pests are concentrated.
Open module
Risk Map
Compare low, medium and high risk levels by country, province and district on the map.
Open moduleStations
See station locations on the map, filter by country, province and district, and check each station's approved record count.
Open module
Detail
Review hourly and daily weather, soil and air quality data for each record location.
Open module
Graphic
Analyze insect and plant distributions, time series and the riskiest regions with charts, and export them as PDF.
Open module